Cadence lock: why your watch shows your cadence instead of your heart rate
The useful signal in an optical heart rate sensor is just 1–2% of the reflected light, and every foot strike attacks it from three directions at once. Here is why your heart rate “sticks” at 180 during intervals — and why no firmware update will fix it.
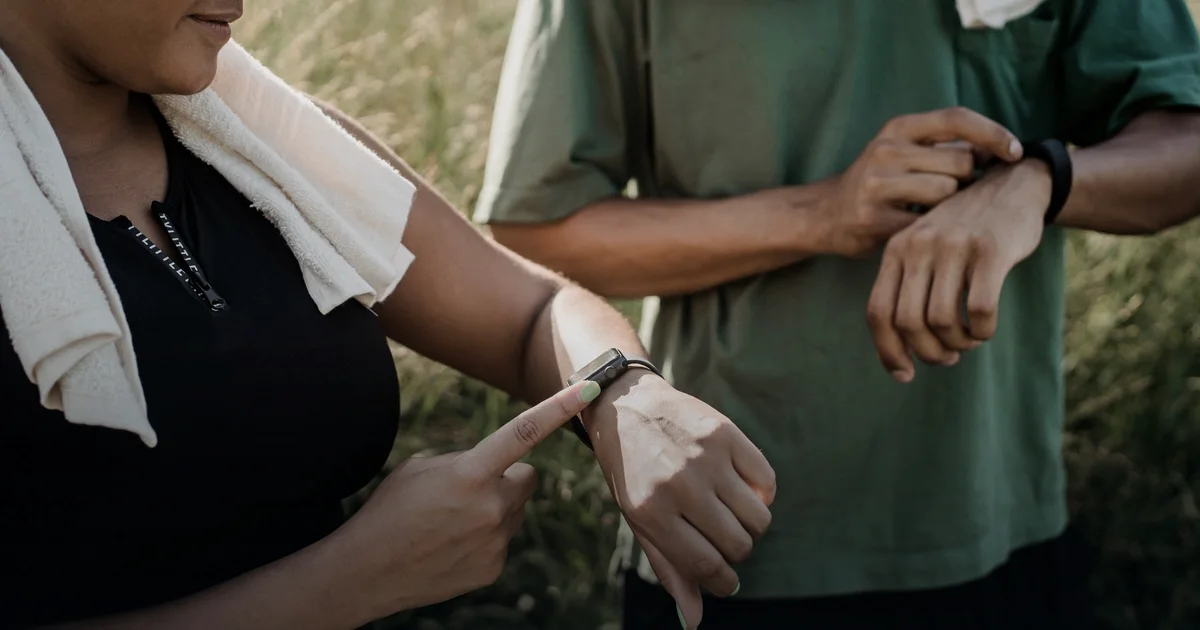
A familiar scene: you start your intervals, pick up the pace — and the watch reads 178 beats per minute. You glance at the second data field: cadence 178. Another rep — heart rate 180, cadence 180. The match is perfect, and perfectly suspicious, because real data never behaves like that. This is cadence lock, the most common failure mode of optical heart rate monitoring. And its root cause is not bad firmware — it is physics.
The useful signal lives a hair's breadth from the noise
An optical heart rate sensor (photoplethysmography, PPG) shines an LED into the skin and uses a photodiode to catch the backscattered light. The signal has two parts.
The DC component is the large, slow background: light absorbed by skin, bone, muscle, venous blood and the non-pulsatile part of the arterial blood. The AC component is the tiny pulsation in time with the heart: during systole the volume of arterial blood rises and absorption increases, during diastole it falls.
And here is the key number from which everything else follows: the AC component accounts for only 1–2% of total light absorption. The ratio of AC to DC is called the perfusion index — essentially a measure of how strong the useful signal is. At the wrist it is low: there are few vessels and they sit deep, which makes the wrist an inherently “noisy” location.
The practical meaning is simple. The useful signal rides on top of an enormous background and makes up a couple of percent of it. Any disturbance of comparable amplitude drowns it out. This is exactly what makes PPG fundamentally different from a chest strap: an ECG measures the heart's electrical potential directly, rather than trying to make out a two-percent ripple in reflected light.
The impact hits the signal from three directions at once
Foot strike and the shock wave travelling up the limb create not one source of interference, but several at the same time.
Sensor displacement relative to the skin. With every impact a loosely strapped sensor slips microscopically. The LED–tissue–photodiode geometry changes, along with the angle of incidence and the length of the optical path; ambient light leaks into the gap. This is the most powerful of the mechanisms — and the only one you fully control by tightening the strap.
Fluctuating contact pressure. The impact modulates how hard the sensor presses, and that pressure determines the volume of the vascular bed underneath it. There is a subtlety here: pulse wave amplitude is greatest when transmural pressure is close to zero — that is, when the external pressure roughly equals mean arterial pressure and the vessel wall is “unloaded”. Pressure oscillations from each step drive the operating point back and forth along a nonlinear compliance curve, and the shape of the pulse wave starts dancing in time with your steps.
Venous blood. At rest, venous blood belongs to the motionless background. Under repeated jolting, the compliant venous bed begins to oscillate in volume — producing a spurious pulsation synchronised not with the heart, but with the movement.
On top of that, the shock wave itself modulates blood flow in the microcirculatory bed under the sensor. In other words, it is not only the optics that get distorted but the measured object as well. And all of these disturbances share one and the same frequency — step frequency.
Why an algorithm cannot fix this
Most algorithms look for the heart rate in the frequency domain: they take a window of signal, compute the spectrum and pick the dominant peak.
Now do the arithmetic. A cadence of 160–190 steps per minute is 2.7–3.2 Hz. A heart rate of 160–190 beats per minute is the same 2.7–3.2 Hz. Both signals also have a rich harmonic structure. When the peaks converge, the algorithm sees two neighbouring maxima, and the motion peak is almost always the taller one — because the useful signal is 1–2%, while the mechanical interference from impact is powerful. The algorithm dutifully takes the larger peak and locks onto cadence.
This is a fundamental limitation, not an oversight: when two quantities physically share the same frequency, no frequency-domain method operating on a single channel can separate them. Subtracting the cadence spectrum subtracts the heart rate along with it.
Plenty of countermeasures have been devised — an accelerometer as a reference signal, adaptive filtering, spectral subtraction, the TROIKA and JOSS algorithms (reported average errors of 2.34 and 1.28 beats per minute respectively), multi-channel and multi-wavelength sensors. Green light around 525 nm is used precisely because it does not penetrate deeply and gives a better AC/DC ratio than red or infrared. All of it works — as long as heart rate and cadence are distinguishable. At the point where they coincide, every method has the same blind spot.
The frustrating part is that this point falls exactly where the data matters most: at threshold and interval paces. As you speed up, the power of the impact signal grows and your heart rate climbs towards your cadence at the same time.
Why the shin is the worst place for a sensor
Impact loading drops off sharply from the bottom up. Simultaneous measurements with inertial sensors on elite junior long-distance runners at 14–16 km/h produced:
- tibia: 14 ± 3 … 16 ± 3 g;
- sacrum: 4 ± 1 … 5 ± 1 g (about 32% of the load at the shin);
- scapula: 4 ± 1 g (about 27%).
In other words, the shin takes an impact roughly 3.5–4 times stronger than the shoulder girdle, and nearly three quarters of the shock wave is damped out on the way up.
There are several reasons. Over the tibia there is almost no muscular damper — the wave reaches the sensor unattenuated, whereas at the upper arm the layer of soft tissue is thicker. The natural frequencies of leg soft tissue lie roughly in the 10–50 Hz range, and impact excites them directly. And as fatigue sets in, the damping capacity of the muscles declines, so tibial accelerations increase towards the end of a long race.
Direct comparisons bear this out. In an independent validation of three identical sensors worn simultaneously on the wrist, forearm and upper arm, the upper arm consistently outperformed the other positions. The arm-worn Polar Verity Sense showed a MAPE of about 0.69% during easy running, whereas wrist devices typically produce errors of a different order while running: in a validation on cardiac patients, running yielded a MAE of 12.1 beats per minute and a MAPE of 8.5% — against 3.8% for walking and the usual 1–3 beats at rest.
What to do about it
- If you need trustworthy heart rate, use a chest strap. An ECG measures the heart's electrical activity directly and is fundamentally immune to cadence lock. If you need better than ±5 beats of accuracy during dynamic efforts, there is no alternative.
- If you will not wear a strap, put the optical sensor on the upper arm or forearm. Impact there is several times lower, blood flow is more stable, and the error approaches strap territory.
- Never mount an optical sensor on the shin. It is the worst position available.
- If you wear a watch, tighten the strap. Firm contact removes the main mechanism behind the artefact. Slide the watch slightly above the wrist bone, and in cold weather warm the wrist up: vasoconstriction reduces perfusion and makes lock-on more likely.
- Display cadence next to heart rate. If the two numbers have fused together, the data cannot be trusted.
- Check after the fact. Overlay the heart rate trace on the cadence trace. Lines that coincide during intervals, surges and descents are a sign of an artefact, not of cardiac dynamics. Do not let sessions like that corrupt your training load and recovery calculations.
- Know your risk zone. If you have a high cadence (around 180) and a high working heart rate (around 180), you are at elevated risk. If the two are well separated in frequency, the optical sensor will go wrong noticeably less often.
Caveats
Absolute impact loads depend on speed, landing technique, footwear, surface and fatigue — what holds up robustly here is the relationship “the shin takes far more than the shoulder”, not the specific numbers. There is almost no reliable published data on peak impact accelerations at the wrist, so the wrist-versus-shin comparison should be treated as qualitative. Manufacturers' specific algorithms are proprietary: the methods described here are the published scientific base, not confirmed contents of anyone's firmware. And the error figures quoted come from specific studies on specific populations — they show the order of magnitude and the difference between activities, not a universal constant.
Key points
- The useful PPG signal is only 1–2% of total light absorption; everything else is background.
- Each impact generates three disturbances at once: sensor displacement, fluctuating contact pressure and venous blood pulsation — all at step frequency.
- Cadence lock is a physics problem: a cadence of 160–190 and a heart rate of 160–190 both give the same 2.7–3.2 Hz, and no frequency-domain method can separate them.
- The shin takes an impact 3.5–4 times greater than the shoulder (14–16 g versus 4 g), making it the worst place for optics.
- The hierarchy of solutions: chest strap → upper arm or forearm → a tightly fastened watch.
- Diagnosis: if heart rate matches cadence, the data is not valid.
Sources: Ueberschär O. et al. “Measuring biomechanical loads and asymmetries in junior elite long-distance runners through triaxial inertial sensors”, Sports Orthopaedics and Traumatology, 2019, reproduced in the review by Sheerin K. et al. “The measurement of tibial acceleration in runners”, Gait & Posture. https://www.sciencedirect.com/science/article/abs/pii/S0949328X19301449. Zhang Z., Pi Z., Liu B. “TROIKA: A General Framework for Heart Rate Monitoring Using Wrist-Type Photoplethysmographic Signals During Intensive Physical Exercise”, IEEE Transactions on Biomedical Engineering, 62(2):522–531, 2015. Zhang Z. “Photoplethysmography-Based Heart Rate Monitoring in Physical Activities via Joint Sparse Spectrum Reconstruction”, IEEE Transactions on Biomedical Engineering, 62(8):1902–1910, 2015. Cheng D. et al., validation of wrist photoplethysmography, European Heart Journal — Digital Health, 6(5):1024, 2025.